简介
linux中使用了”延迟绑定“的技术,在第一次调用某个库函数的时候去解析它的地址并存入got表中,下次调用的时候直接从got表中拿不用重复解析,这样做提高了动态链接的效率。
本篇主要通过调试的方式来了解这个过程。#调试器里出真知#
调试分析
下面用调试一个例子:
1
2
3
4
5
6
7
8
9
|
// gcc -m32 -g test-plt.c -o test-plt32
#include <stdio.h>
#include <unistd.h>
int main()
{
    char data[20];
    read(0,data,20);
    return 0;
}
|
1
2
3
4
|
pwndbg> disassemble main
...
0x08048492 <+39>:    call   0x8048330 <read@plt>
...
|
call的地方下断点
 1
 2
 3
 4
 5
 6
 7
 8
 9
10
11
12
13
14
15
16
17
18
19
20
21
22
23
24
25
26
|
pwndbg> r
Starting program: /vagrant/pwn/binary/test-plt32

Breakpoint 1, 0x08048492 in main () at test-plt.c:7
7           read(0,data,20);
LEGEND: STACK | HEAP | CODE | DATA | RWX | RODATA
───────────────────────────────────────────────────────────────────────────────────[ DISASM ]────────────────────────────────────────────────────────────────────────────────────
 ► 0x8048492 <main+39>    call   read@plt <0x8048330>
        fd: 0x0
        buf: 0xffffccc8 —▸ 0xf7e43a50 (__new_exitfn+16) ◂— add    ebx, 0x1835b0
        nbytes: 0x14

   0x8048497 <main+44>    add    esp, 0x10
   0x804849a <main+47>    mov    eax, 0
   0x804849f <main+52>    mov    edx, dword ptr [ebp - 0xc]
   0x80484a2 <main+55>    xor    edx, dword ptr gs:[0x14]
   0x80484a9 <main+62>    je     main+69 <0x80484b0>

   0x80484ab <main+64>    call   __stack_chk_fail@plt <0x8048340>

   0x80484b0 <main+69>    mov    ecx, dword ptr [ebp - 4]
   0x80484b3 <main+72>    leave
   0x80484b4 <main+73>    lea    esp, [ecx - 4]
   0x80484b7 <main+76>    ret
─────────────────────────────────────────────────────────────────────────────────────────────────────────────────────────────────────────────────────────────────────────────────
Breakpoint * 0x08048492
|
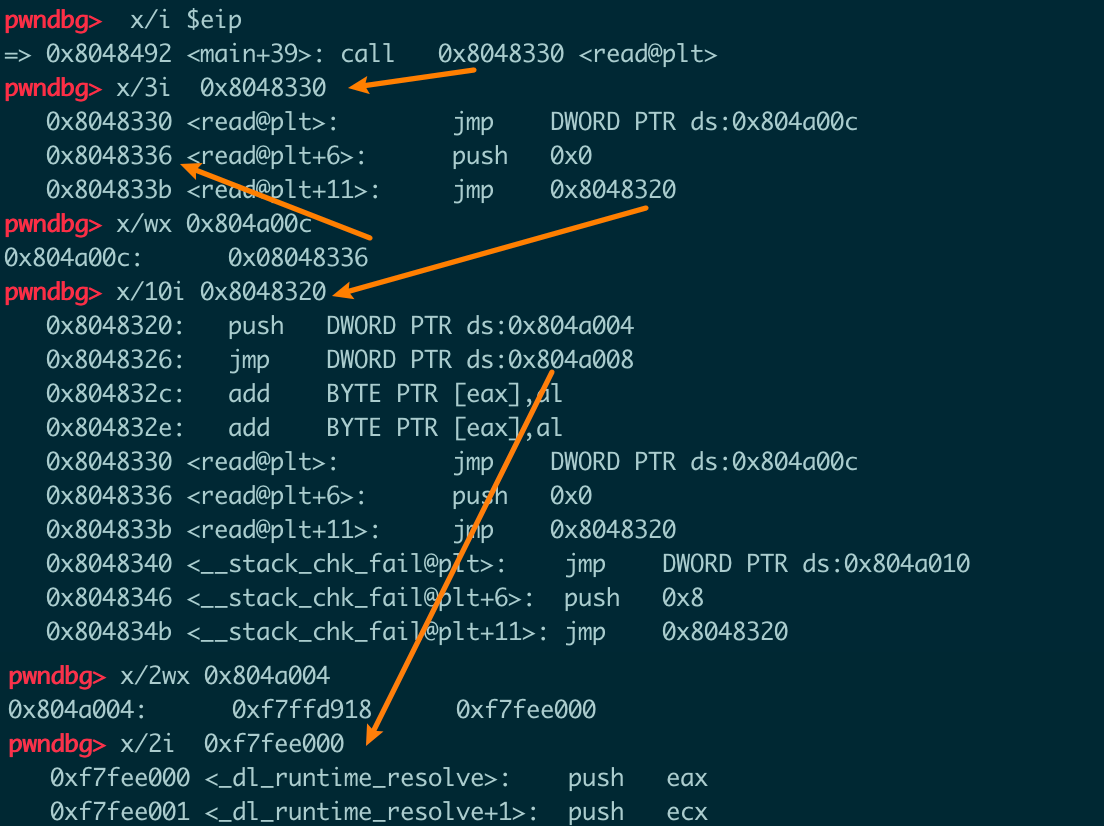
可以看到call的地址是read@plt<0x8048330>,不是read的真实地址。
后面一路单步运行(si)。
跳到plt中:
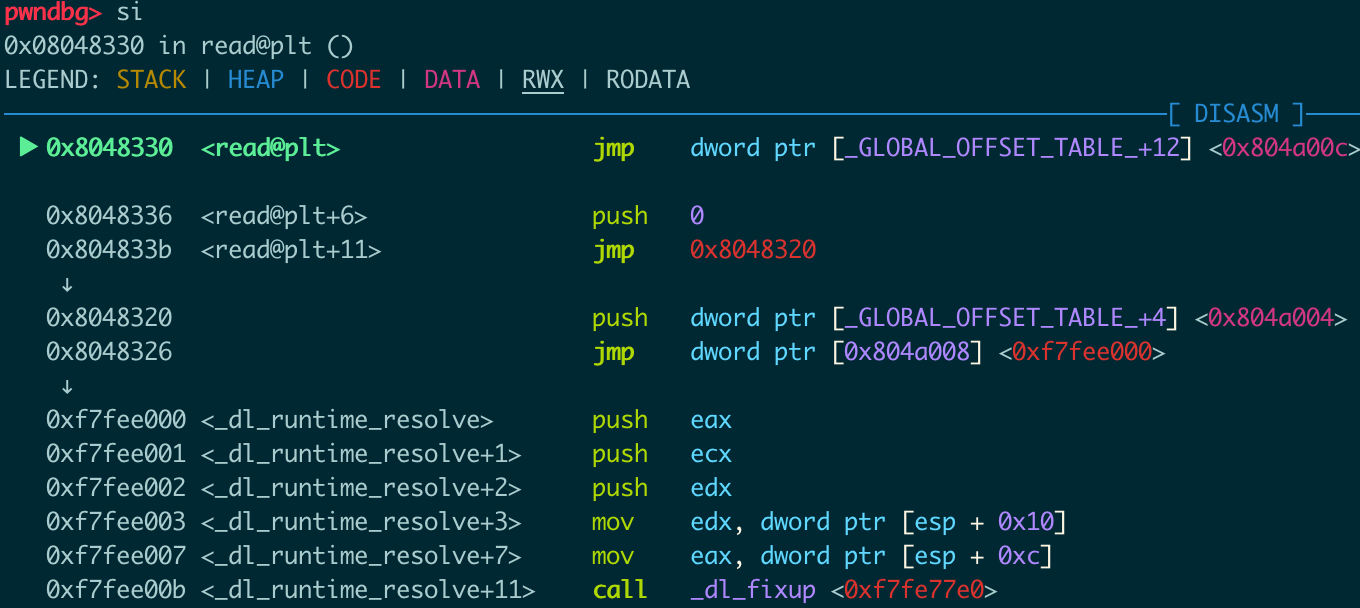
查看got+12处(0x804a00c)的值( 0x08048336),跳到此处:
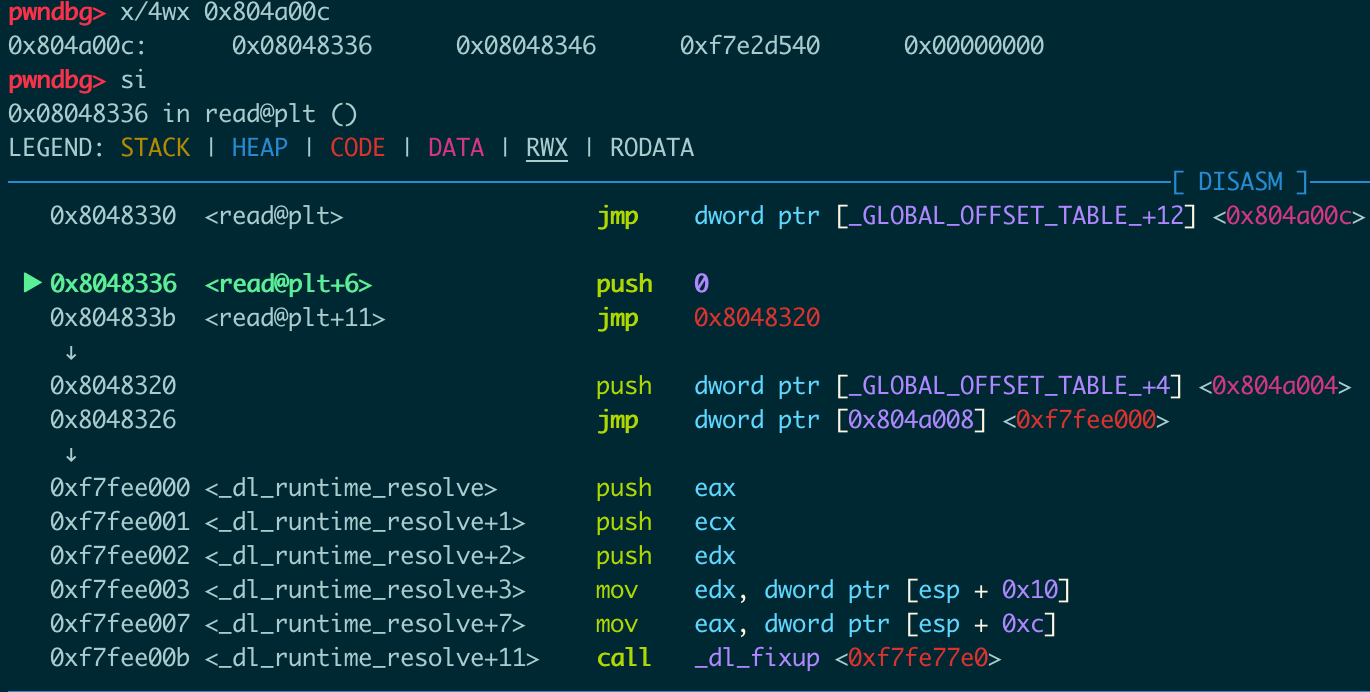
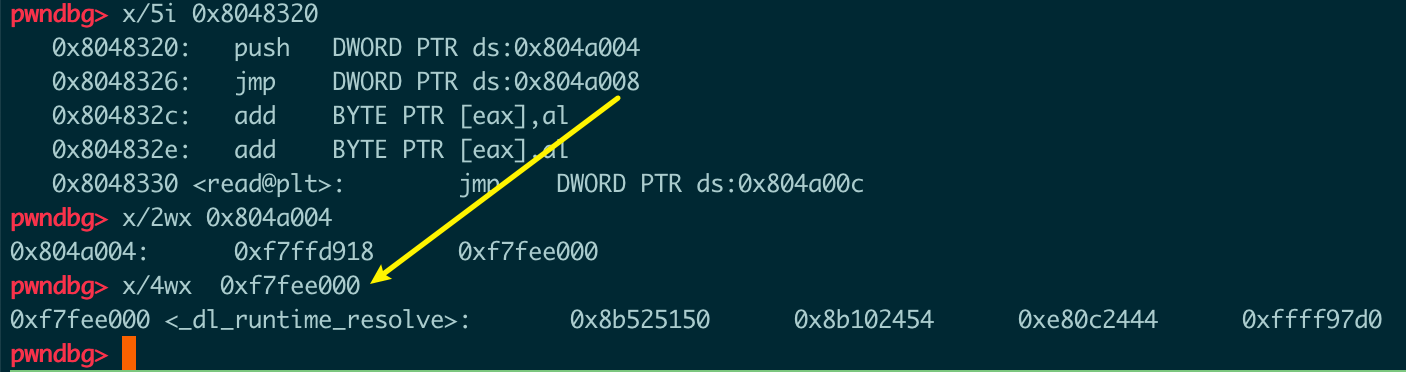
压0入栈,跳到0x8048320:
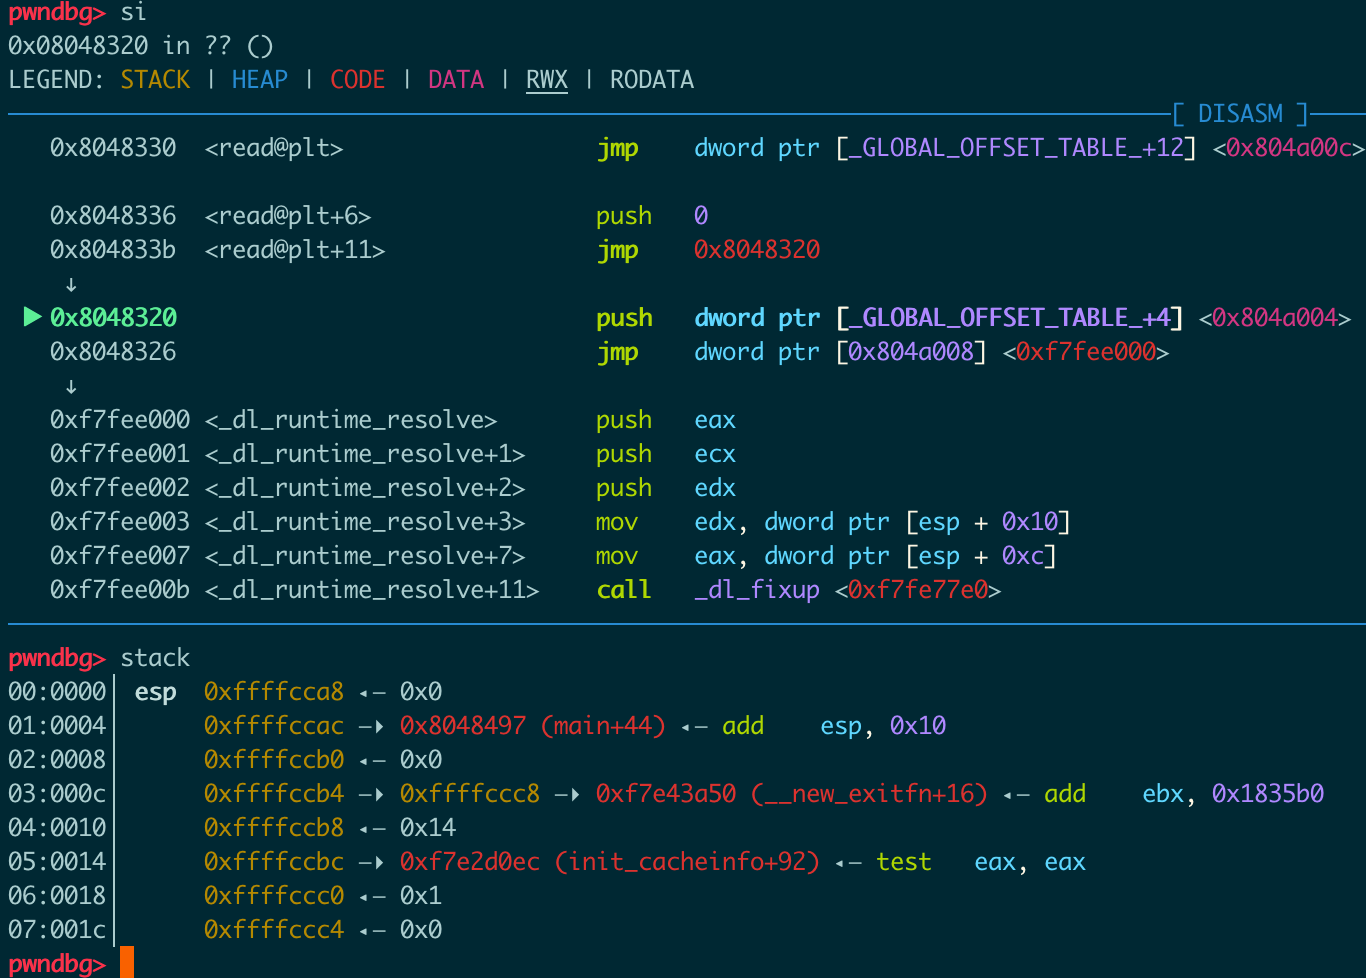
压got+4处的值入栈,跳到got+8处的值(_dl_runtime_resolve的地址):
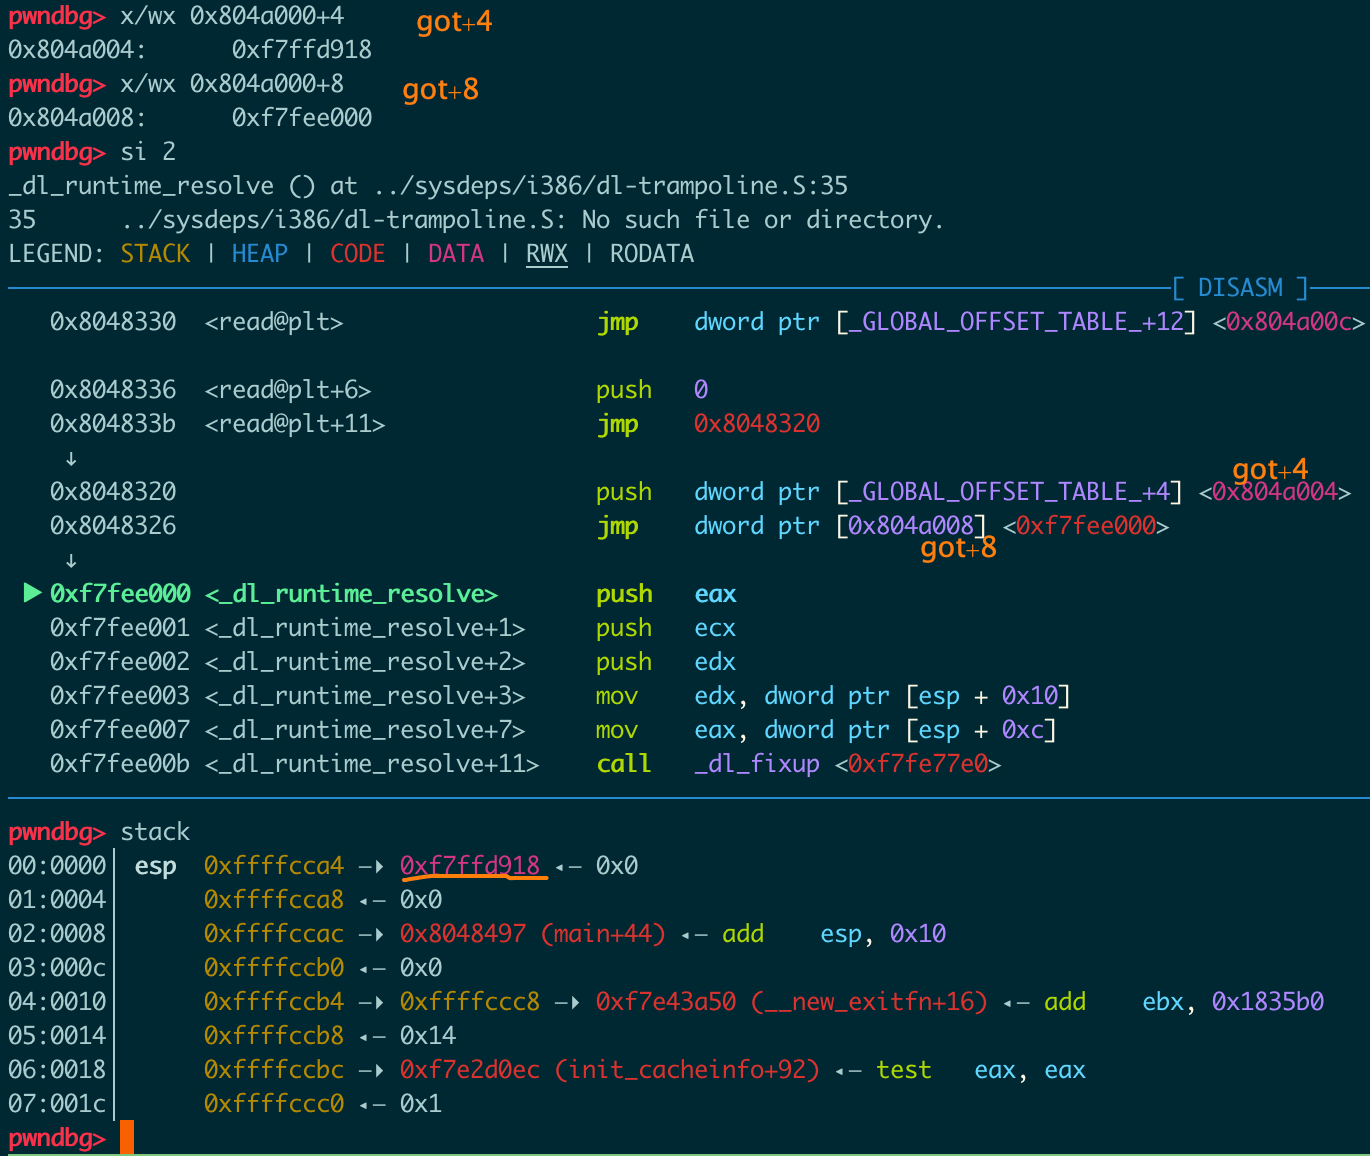
后面进入 _dl_runtime_resolve函数,_dl_runtime_resolve处理了参数之后调用了 _dl_fixup
找源码(dl-runtime.c:66)看到函数_dl_fixup有一段注释:
1
2
3
4
5
6
|
/* This function is called through a special trampoline(蹦床) from the PLT the
   first time each PLT entry is called.  We must perform the relocation
   specified in the PLT of the given shared object, and return the resolved
   function address to the trampoline, which will restart the original call
   to that address.  Future calls will bounce directly from the PLT to the
   function.  */
|
简单翻译一下:在每个PLT entry第一次被调用时这个函数被调用,返回解析过的的函数地址并恢复之前的调用。之后再次调用时直接通过PLT找到真实地址。
执行完_dl_fixup,可以看到got中read的真实地址被填入了,此时read地址被放入了eax中(截图漏了)
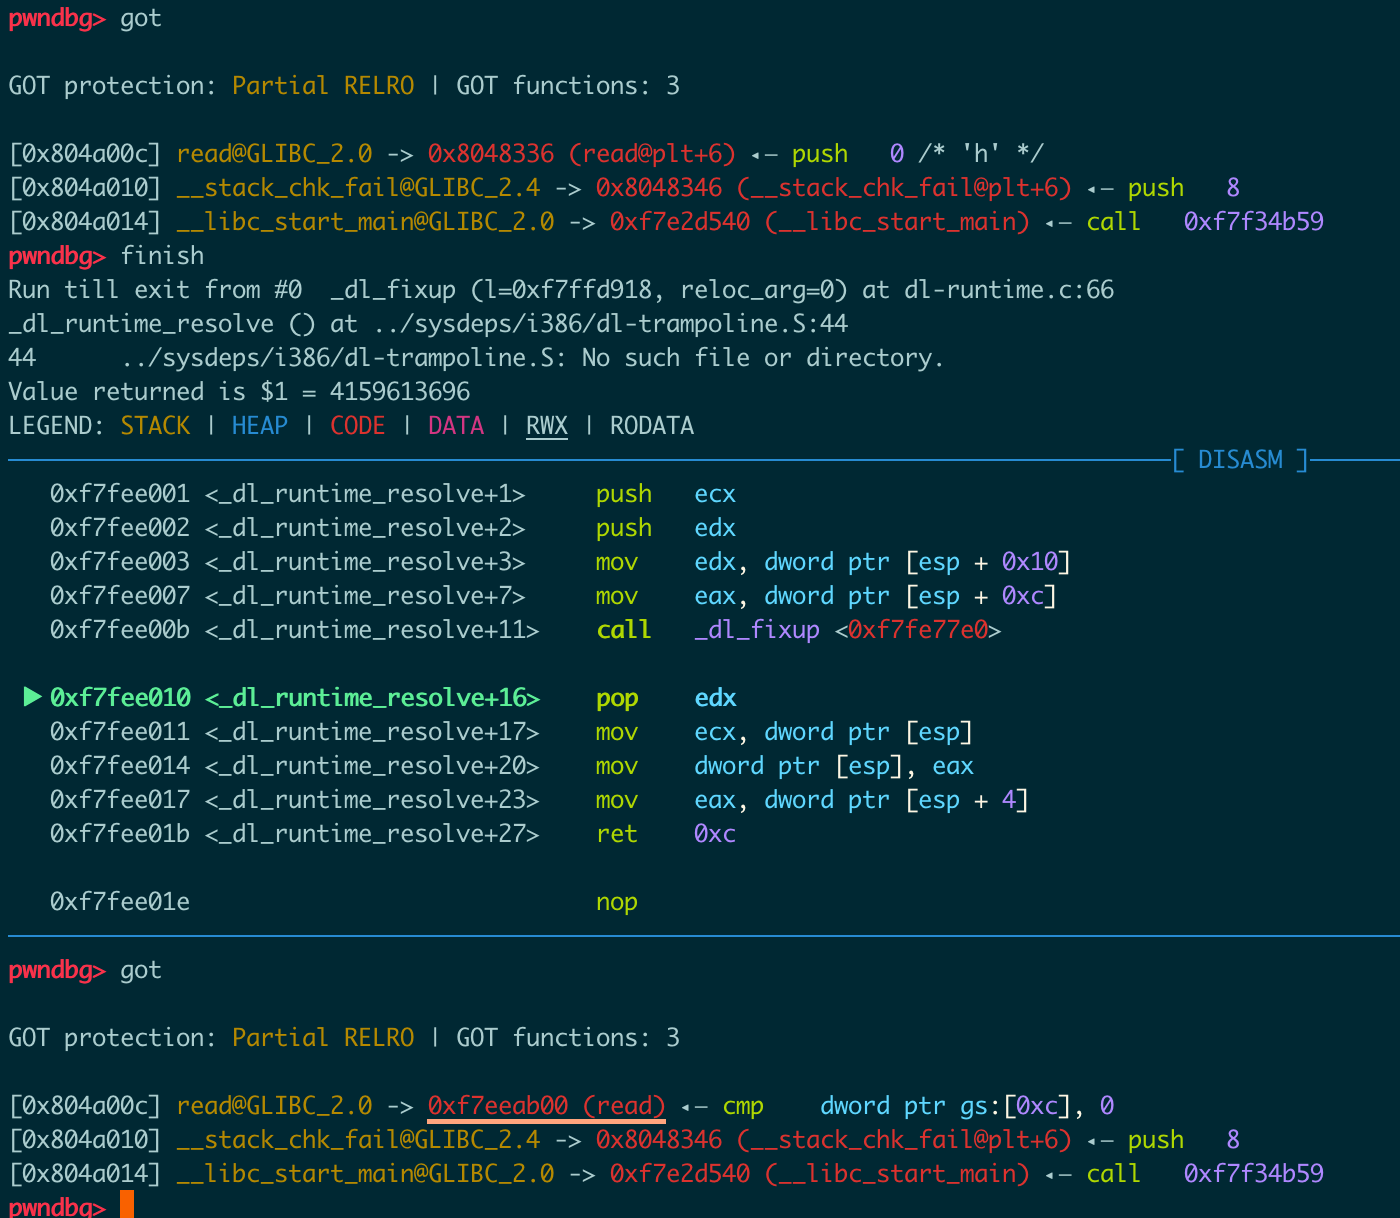
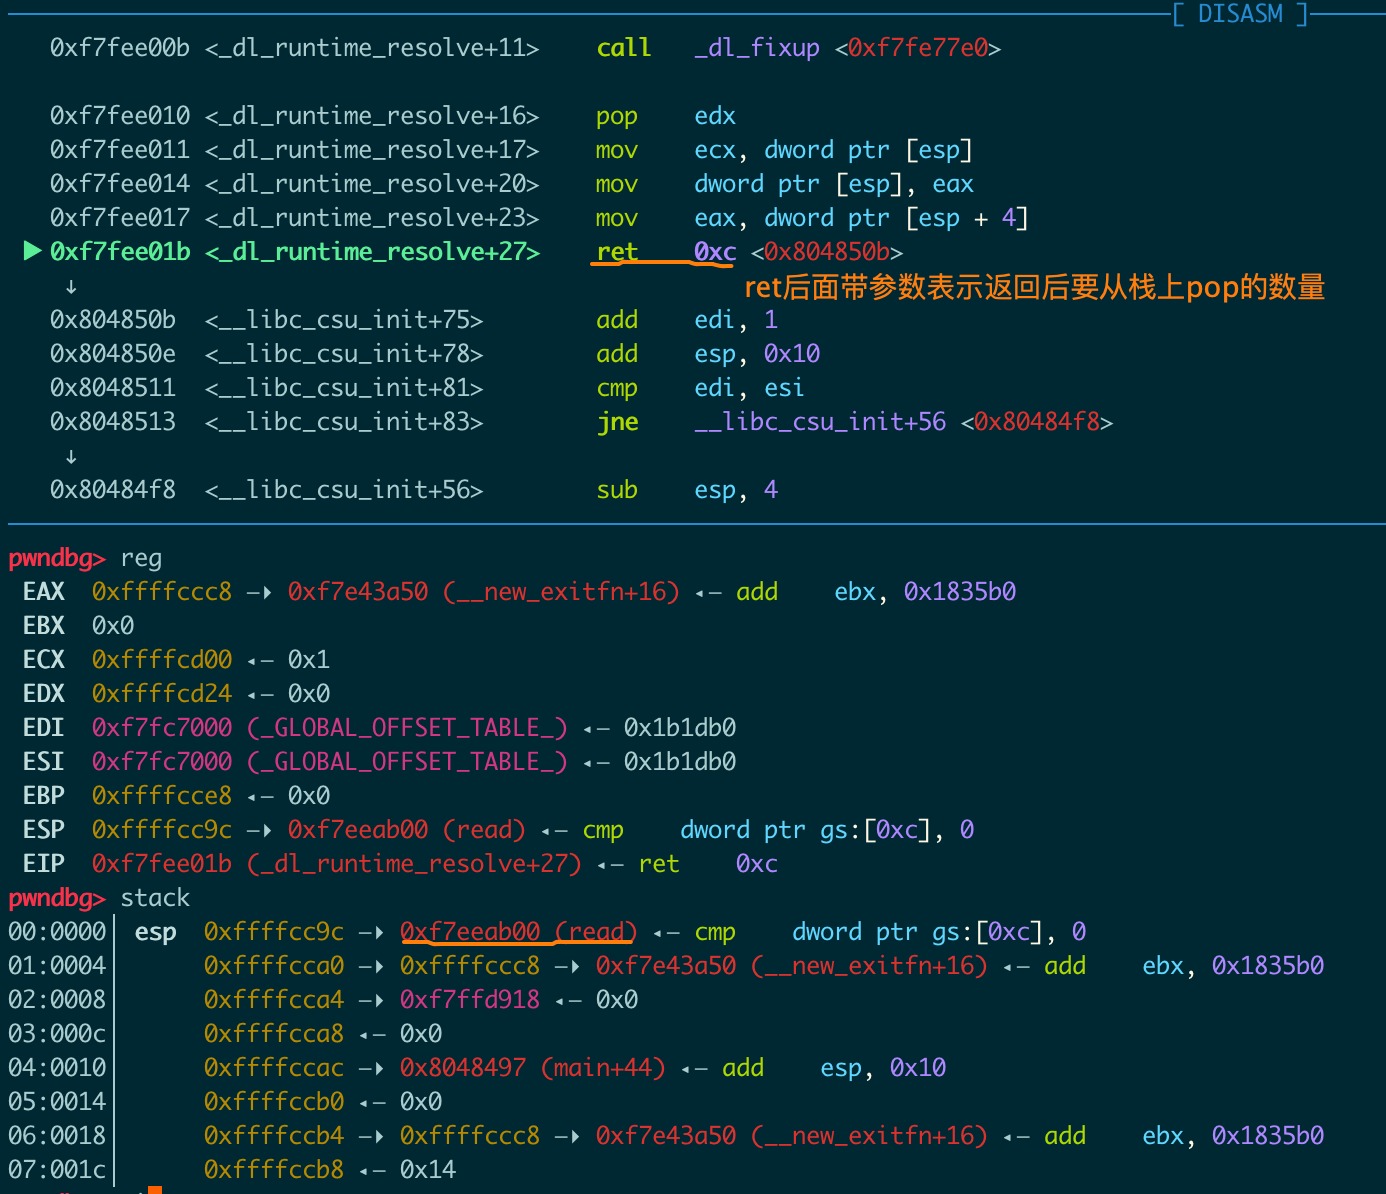
_dl_runtime_resolve返回时,返回到read处并清理栈(汇编中ret后面带参数表示返回后要从栈上pop的数量)
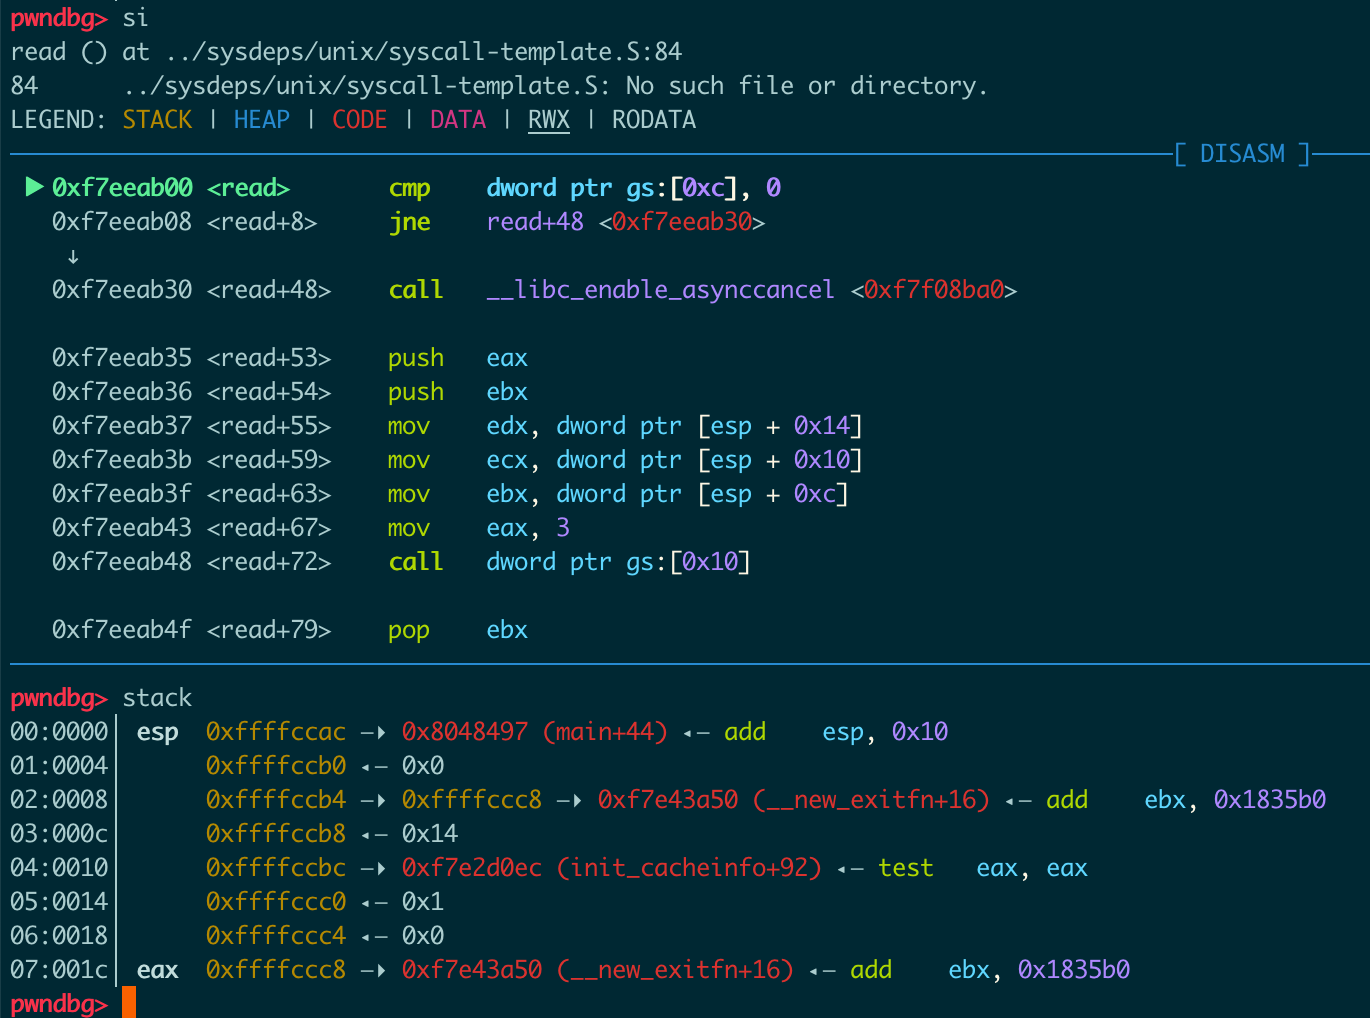
跳到真实的read地址中:
流程总结
总结一下流程:
从call到dl_runtime_resolve
一张图看一下从call plt到dl_runtime_resolve的过程:
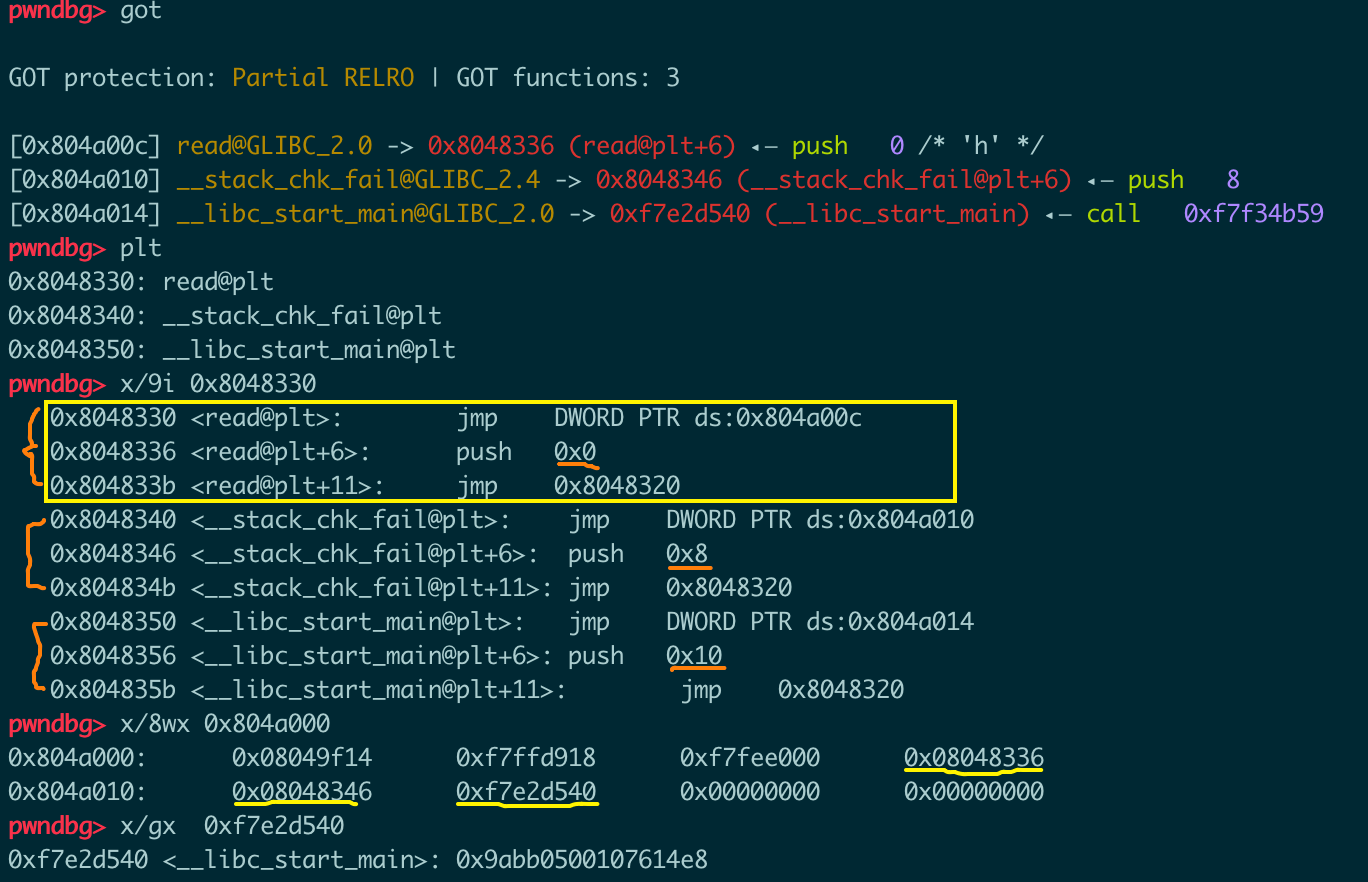
got和plt
下图中可以看出,got表中有三项,对应三个glibc中的函数,因为此时还没有执行read和stack_chk_fail(检查canary的函数),但是已经执行过__libc_start_main,所以只有它在got表中的值是函数的真实地址,其他两个都指向self@plt+6的位置。
可以看到,图中每个橘黄色的括号代表一个plt表的一项内容,每项中有三条指令。第一条跳到对应的got项,对于read这种此时还未调用过的函数,就会又跳回plt项中的第二条指令处(self@plt+6),把一个偏移值压栈后跳到plt表上方0x10处,调用dl_runtime_resolve开始解析的逻辑。而对应已经调用过的函数,则会直接跳到函数真实地址处。
通过之前的流程分析我们已经知道,在解析完成之后,真实地址会被写入got表中,下次调用的时候就不用重新解析了。
参考
https://ray-cp.github.io/archivers/ret2dl_resolve_analysis